BY Andy Black
What is Grid Parity?
The term ‘Grid Parity‘ has become the ‘in vogue‘ phrase relating to PV systems as markets have expanded and the public, the financial world, and the political world take ever closer looks at when does PV start to ‘make economic sense‘.
There has been much discussion about when photovoltaics will reach ‘Grid Parity‘ with commentary that parity will be reached in southern Europe within a few years, and perhaps an additional 5-10 years in northern Europe1).
Similar comments have been tossed about regarding the U.S. market. Or sometimes the question is asked, “At what installed price will PV reach grid parity?“ The international PV journals imply that once PV reaches parity, a market in the trillions of kWh/yr of demand for PV energy will be created.
Unfortunately, all of these approaches seem to view ‘Grid Parity‘ as a singular or unique price per kWh within a particular geographic market space, and if solar cost drops below a particular price point, the market will explode in a nearly unbounded way. A more reasoned approach recognizes that for a group of customers in a marketplace, the cost per watt or kWh of PV and the effective savings per kWh of PV output vary across ranges in a distribution pattern. So ‘Grid Parity‘ is not the crossing of a specific PV energy cost below average grid cost, but the crossing of the distribution range of PV energy costs into and through the distribution range of grid energy costs.
PV Energy Costs Vary
PV costs per watt vary due to many factors including module, inverter, wiring & racking component costs, mounting difficulty depending on roof type or ground conditions, labor costs, and profit margins. Costs per kWh in the first year of production will depend on insolation, tilt, orientation, shading, local soiling conditions, and the many smaller loss factors that affect real system performance.
Lifetime costs per kWh produced (on a levelized or other basis) will depend on discount rates or cost of borrowing, investor expectations, module & system degradation, system availability, inverter replacement costs, maintenance, etc.
All of these factors vary from site to site, contractor to contractor, product to product, and investor to investor. There may be an “average cost“ but there will also certainly be a range. The publicly available data from California‘s several incentive programs shows that there is a range in installed cost per CEC AC rated watt from below US$6.00 to above US$11.00 in the last 7 years2). Figure 1 shows the distribution of system installed pricing for commercial sized systems in California from 2001 to 2007. Variations across tax status (residential, commercial, nontaxable), residential tax bracket, Alternative Minimum Tax, Corporate vs. Non-Corporate business tax rates, and state tax rates will affect system net cost, and the cost of energy produced from identical systems.

Grid Energy Costs Vary
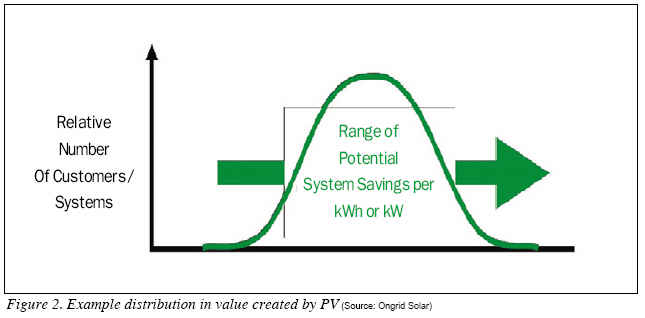
Similarly, the value of the savings from a PV system on a per kWh basis varies significantly from customer to customer (often even between those on the same rate schedule) usually on both the production and consumption side of the calculation. It will vary on the consumption side because of the customer‘s usage patterns with respect to time-of-use electric rates, total consumption on a tiered electric tariff, current demand charges and the customer’s ability to eliminate or reduce demand charges with PV and load management and/or rate schedule switching to a non demand rate schedule. It varies on the production side due to tilt, orientation, shading and alignment of production with demand. Figure 2 illustrates a simple distribution in value creation. In reality, residential PV systems in Hawaii net meter on some islands for over US$0.33/kWh, but on others at “only“ US$0.20/kWh. In PG&E territory Tier 5 on-peak net metered energy is worth US$.54/kWh, where Tier 1 off-peak energy is worth US$0.07/kWh.
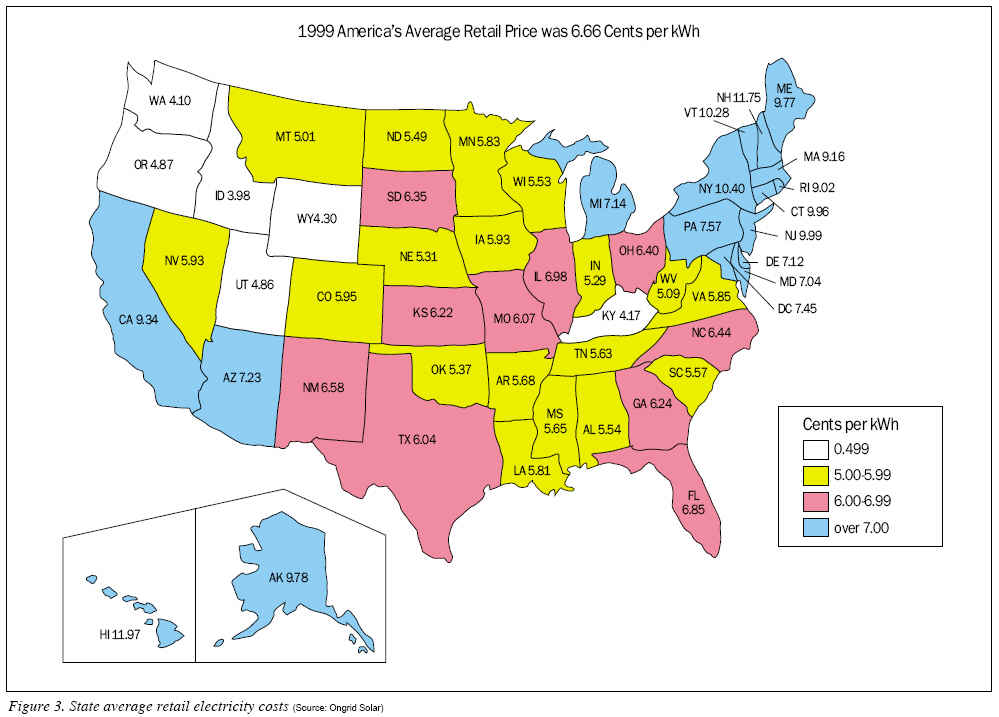
Looking more broadly across the customer base and their respective rate schedules from residential (possibly tiered & time-of-use), to small commercial flat rate non-demand, to large commercial time-of-use & demand the average cost of electricity and benefit from PV varies dramatically. This broadens the distribution. Looking even more broadly across utilities and from state to state and region to region, we see even bigger ranges in the net-metered value of a kWh of PV output (again represented by the simple distribution in Figure 2). Figure 3 shows the broad range of average energy costs across the U.S. As electric rates rise, this distribution will shift to the right. Note that there is no correlation between average rates and sunlight levels. Ultimately, production from a system based on local sunlight levels will play a major factor in the analysis of PV system economics.
Motivation by Financial Results
PV cost and savings value can be analyzed to calculate the rate of return for a particular situation (IRR).
Calculated Rates or Return Vary
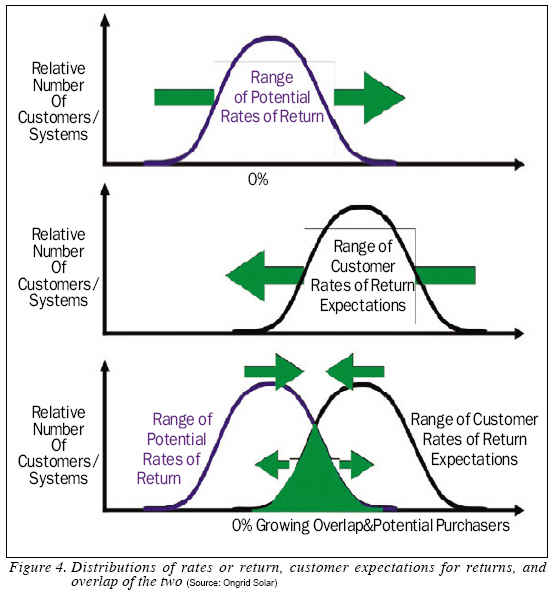
Because cost and savings are independent distributions, the range of Rates of Return is also a distribution, illustrated in the top graphic of Figure 4. Subsidies and incentives can affect either the net system cost or the per-kWh value enjoyed, and generally improve the rate of return. As costs drop and savings increase, the distribution of rates of return shifts higher. However, as subsidies are reduced, this improvement in returns will be retarded, or potentially completely offset.
Customer Expectations Vary: Risk vs. Reward
There is also a range in customer expectations of an acceptable rate of return that would entice them. This is evidenced regularly in the financial markets all over the world. As interests rise (or are pushed higher), investors move towards money funds, CDs, bonds, and treasuries and away from equities. Within many well-managed portfolios there is usually some diversity among the assets owned. High-risk securities need to be estimated to pay a higher return to be worth the risk, yet investors still put some of their money in “safer“ investments for the security. It happens within an individual, and it certainly happens among investors. Some investors won‘t touch high-yield “junk“ bonds while others love them.
The same will be true of how solar is viewed. Some see it as safe enough that the yield is acceptable. Others don‘t know enough about it, don‘t trust it, and will wait until it becomes safer, or pays a better return before they are attracted. This is the distribution of expectations in action.
Overlap in the Distributions of Return and Expectation
Where there is overlap of calculated returns compared to customer expectations, there exists a potential market (bottom graphic in Figure 4). The efficiency of the market in matching potential with expectations (through marketing) will be important. This information flow is the job of the marketing department, and is a function of the level of penetration into the market. Once “everyone knows someone with PV,“ the information will flow much more readily from those with systems, to those contemplating a purchase. The level of trust and comfort will improve, diminishing the required rate of return, shifting the “expectations“ Distribution to even further overlap with the “Returns“ Distribution.
Evidence in the Market
This is not to say that everyone with a high rate of return will purchase, and those with a low rate or return won‘t. The author knows of two anecdotes where a large potential customer could have earned up to 20% Pre-Tax IRR on a large PV investment, but chose to pass because he had another business that could do even better, and it was a business that he understood, unlike PV, which was new to him. The other case was a couple with a modest lifestyle (their energy usage was in Tier 1 & 2 of PG&E’s rates), but their response to the presentation of a 5.6% IRR was, “It’s better than our savings account, let‘s do it“. Each of these customers had very different hurdles due to their varying levels of comfort with PV, and their varying desires to earn the highest rate or return they could. There are now measurable overlaps in these--the Distributions in the California, New Jersey, Hawaii and Connecticut markets, where significant numbers of customers are going solar solely because of the economics. These are currently occurring largely thanks to incentives, but in California, even an unsubsidized residential system has been shown to be an attractive investment to a small group of high usage homeowners3).
Photon International magazine stated that PV systems become commercial attractive when the IRR exceeds the long-term government bonds by 1-2% (100 to 200 basis points)4). As of February 14, 2008, the 30-year bond was yielding 4.7%, so if solar systems produce IRRs of 5.7% to 6.7% they should be “commercial attractive“. However, many customers in certain places can see results significantly better than that, and some are buying fast, but many others are holding off, and many others cannot see that good a return due to a variety of circumstances.
Rising rates and falling system prices will lead to greater market penetration which will allow consumers to become more familiar with PV through their neighbors systems. This will cause a shift in customer perceived risk and a lowering of the distribution of expectations in rate of return or other measures of “payback“ on a PV system, further expanding the potential market.
However, there are inherent risks in some markets. New Jersey currently does not in general make long REC contracts available to those with PV systems, so there is a reasonable risk that RECs may not be worth as much in the future, so that potential income must be heavily discounted.
This means that the potential upside must be augmented, but at the cost of greater risk. Were NJ utilities or aggregators of RECs willing to purchase RECs on a longer contract, customers would not need such a high potential return to persuade them to purchase.
A Moving Target
In essence, grid parity has already been reached by those customers who have purchased on an economic basis, because their particular set of circumstances, and their expectations of what a system should be able to do are in alignment with producing a satisfactory economic result.
On the other hand, the vast majority of utility ratepayers have either not yet become informed of a possible favorable situation, or more likely, the economics don? yet pencil out for them in a satisfactory way.
While the market may grow rapidly at times, it will not grow in an unbounded way, as there is no specific price point at which ‘Grid Parity‘ will be reached.
Grid parity will remain an elusive, moving target, that is reached in more and more situations as rates rise, costs drop, and expectations on returns are lowered because perceived risk is diminished.
----------------
Andy Black is CEO of OnGrid Solar (http://www.ongrid.net/).
REFERENCES
1) Rogol’s Monthly Market Commentary, Photon International, March 2007, p106-108
2) Data from Statewide California Solar Initiative Projects to Date, CSI Statewide Data May 07 spreadsheet, May 2007
3) Black, A., Financial Payback On Residential California Solar Electric Systems After The State Rebates Are Gone, Proceedings Of The 33nd ASES Annual Conference, The American Solar Energy Society, July 2004
4) Rogol’s Monthly Market Commentary, Photon International, p114, August 2007
For more information, please send your e-mails to pved@infothe.com.
ⓒ2010 www.interpv.net All rights reserved.
|


.jpg)