By Sol Haroon, Anthony Coker
.jpg)
.jpg)
Economic Analysis
Traditionally, electricity prices are measured in cents-per-kWh as the actual measure of energy. Arriving at this as a metric for various methods of generating electricity can be complicated. Numerous energy sources such as oil and coal are heavily subsidized, and factoring in the cost of environmental degradation, health-associated costs and other externalities is difficult. Nonetheless, grid parity is an oft- mentioned term─it is the point at which alternative means of generating electricity (such as solar) become at least as inexpensive as the standard existing grid rate.
Use of the installed cost-per-watt metric is simplistic, since it is just a snapshot in time without any consideration of energy production over a period of time. Crystalline PV module costs have come down dramatically over the last few years. Accordingly, the fierce activity in balance of systems, such as racking, has produced excellent product lines at very competitive costs. Developments in inverters (such as transformerless and more-efficient, reliable electronics) have also resulted in a price drop and increased output.
For a hypothetical ground-mount 1 MW DC system, the module may account for approximately a third of the total cost with another third taken up by the BOS components. Thus, there is considerable influence of these components on the system’s financials.
In addition to the material cost of modules and BOS, there are other costs to consider such as land preparation, grid interconnection, engineering/design, permitting, and sales tax. Moreover, financing and credits/rebates directly affect the cost structure.
NREL’s System Advisor Model (SAM) is an industry-available program that is useful for understanding PV system costs, the financing behind it, and other metrics. SAM breaks down the system costs into direct and indirect capital.
A direct capital cost represents an expense for a specific piece of equipment or installation service that applies in year zero of the cash flow. These include:
1. Module
2. Inverter
3. Balance of system (racking, combiner boxes, wiring, piping, switches)
4. Installation labor
5. Installer margin and overhead
6. Contingency
Indirect capital costs are those initial costs that are not componentry related:
1. Permitting and environmental studies
2. Engineering
3. Grid interconnection
4. Land (if applicable)
5. Land preparation (if applicable)
6. Sales tax
The above capital costs for a PV system are frequently referred to as installed costs per watt. Other costs are not factored in the cost per Watt such as present value of operation and maintenance, insurance, property tax, replacement costs, etc. For these, one must turn to another financial concept─the Levelized Cost of Electricity (LCOE).
Levelized Cost of Electricity (LCOE)
LCOE is a metric that attempts to allow a fair evaluation of electricity produced by renewable sources (in this case solar) with other fuel-based electricity production. In fact, such a metric attempts to create a level economic field regardless of how the energy is produced allowing comparisons among all methods of electricity production. It takes into account capital costs, ongoing system costs, financial rates (discount rates, taxes, etc.), utilization and fuel costs (if any). All this is taken into account over the lifetime period of the power plant while considering the total amount of energy that is produced over this period.
The LCOE is a measure of lifetime costs divided by total lifetime energy production. The less a system costs and the more energy it produces, the lower the LCOE. In addition to installed costs, LCOE measures costs over the lifetime of the power plant.
The mathematical definition of LCOE is conceptually simple:

Total Lifetime Costs consist of four parts: initial project costs, depreciation, annual operating costs, and residual value (the tax rate is also factored into this). An initial project cost can be affected by federal and state tax credits as well.
Example
Beginning with an install system cost per watt of US$3.10 (realistic for a large commercial install in 2011 with a high performance monocrystalline panel), a 1 MW system is considered. Labor rates and material costs do vary considerably by locale. No tax credits are considered for this. Atlanta, GA, the U.S.A. is chosen as the location since the state is blessed with good irradiation and shows excellent potential for solar deployment.
Total lifetime cost is estimated as the sum of the capital costs and a multiplication factor of 1.4 to account for ongoing maintenance, depreciation, and discount factors. This is clearly a simplification but serves our purpose.
.jpg)
Thus, a medium-sized commercial PV system comes to an approximate US$0.134/kWh (without any incentives). Keep in mind that actual calculations for energy production require a detailed simulation factoring in the solar insolation, tilt angles, shading, temperature, and other environmental and mechanical parameters. Similarly, the total lifetime cost of the system factors in maintenance, depreciation, discount rates, tax incentives, and other financial parameters. Calculating this manually can be tedious. A simulation program such as NREL’s SAM aids greatly in the process. Nonetheless, this simplistic calculation shows us to be in the ballpark of traditional fossil-fuel created power (nation average of US$0.12 to US$0.13/kWh) using today’s PV prices.
There are at least four engineering factors that strongly contribute to reduction of a system’s LCOE:
1. Initial module and balance of system costs;
2. Panel efficiency (directly related to PV cell performance)─The more efficient the panels are, the less the potential BOS costs and subsequently the greater the reduction in LCOE;
3. System capacity factor: A function of the ability of the entire system to produce power over a given piece of land;
4. Reliability: The ability of the panel and the entire system to endure with minimal performance degradation over a typical period of 25 years or more
Different types of LCOE exist. This article discusses two types: real LCOE and nominal LCOE. The following brief discussion on this is excerpted from the SAM user’s manual.
Real LCOE is a constant dollar value that is adjusted for inflation; it is less than the nominal LCOE whenever the inflation rate is greater than zero. Because the nominal discount rate used to compute the nominal LCOE includes inflation, inflation is effectively factored out of the nominal LCOE. The nominal LCOE is a current dollar value. Typically, long-term analyses are conducted in real (constant) dollars to account for the years of inflation over the project life, whereas most short-term analyses use nominal (current) dollars. When comparing LCOEs across systems, it is important to compare the same type of LCOE. The LCOE graphs in this report show nominal LCOEs with and without incentives. What incentives were considered? Tax credits, s-RECs, etc.?
1. How is the Operation and Maintenance costing (O&M) applied? A yearly fixed rate?
2. How about replacement of certain BOS gear such as inverters?
3. What sort of degradation, downtime, or other operational issues are assumed?
To illustrate the performance factors on the LCOE, six case scenarios are simulated in SAM. Both 1 MW and 10 MW ground-mount systems (per the DC-nameplate) are considered. A thin-film panel at 11.9%, a multicrystalline at 14.7%, and a monocrystalline at 16.0% are used for the comparison. Panels are chosen to reflect published market prices at best-in-class efficiency. All parameters are kept the same across the comparison. Panel and BOS costs are typically given as cost per watt. However, it is worth noting how the efficiency of a panel affects the number of panels required to make up the system nameplate. The greater the efficiency of the panel, the fewer the number of panels required (also less area is required). These costs are best reflected for BOS (such as racking and labor rates) when they are given as an area cost (e.g., dollars per meter squared), since these are area-sensitive and not total nameplate kW-sensitive.
The following is common for all considered scenarios:
1. Commercial 1 MW application
2. Fixed ground mount system at an Atlanta site at 30 degrees tilt
3. System lifetime is expected at 25 years with system degradation at 0.5% per year. This holds true for crystalline technologies; thin film will suffer from greater degradation and warranty periods may not cover the full 25 years.
4. Two typical 500 kW central inverters
5. Balance of system, equipment (such as racking) is given at US$81/m2
6. Installation labor is US$28/m2
7. Installer margin and overhead is set at US$80/m2
8. The baseline land preparation is set at US$0.20/W (DC). Baseline is used for the install with the smallest land use. As this is a ground-mount, the actual land cost will be determined by the amount of land taken up for the install. Since costing is given on a per watt (DC) basis, this number is multiplied by a factor if the consumed land is greater than the baseline. The land cost is proportionally multiplied by a linear factor. So if an install takes 0.54 acres and another takes 0.39 acres, its cost will be 1.38 times greater (0.54/0.39).
9. The baseline Operation and Maintenance (O&M) Costs is set to US$15/kW-year. Baseline is used for the install with the smallest land use. As in land cost, the same area ratio factor is applied for land sizes that are larger.
10. 30% federal tax credit. Even though the examples are shown for Atlanta, Ga., where there is a state tax credit, no state tax credits are applied in order to have these examples essentially applicable across all States.
11. No salvage value is assigned to the PV array at the end of the 25-year lifespan.
12. Most of the default financing terms are used as per SAM. These are a WACC of 7.75%, a five-year MACRS depreciation (for both federal and state), an inflation rate of 2.00% and a real discount rate of 8.20%
The costing structure for a 1 MW system is described in the following table.
*Note that these are averaged prices representing a particular snapshot in time. Actual pricing is subject to specific design and contracts. These figures should be taken as a general guideline for relative comparison purposes only.
.jpg)
Scenario 1. Thin film (11.9% Efficiency)
A representative thin-film panel is 11.9% at 85 watts.
The Real LCOE with Federal-only incentives is 13.79 cents/kWh and the Real LCOE with no incentives is 18.85 c/kWh.
.jpg)
Scenario 2. Multicrystalline (14.7% Efficiency)
A representative high quality multicrystalline panel is 14.7% at 240 watts.
The Real LCOE with Federal only incentives is 13.21 cents/kWh; the Real LCOE without incentives is 18.04 c/kWh.
.jpg)
Scenario 3. Monocrystalline (16.0% Efficiency)
A representative high efficiency panel is 16.0% at 260 watts.
The Real LCOE with Federal only incentives comes in at 13.20 cents/kWh; the Real LCOE without incentives is 18.04 c/kWh.
.jpg)
Summary and Conclusion
The three scenarios for the 1 MW system are summarized in the following table (as captured from the SAM models):
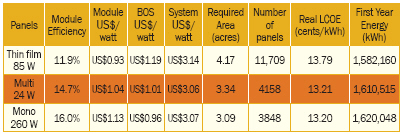
While the cost of a panel generally increases as its performance increases, there is a correlated decrease in BOS cost that in turn leads to an overall system cost reduction. BOS here includes the racking, the inverter(s), the gear between them (such as combiner boxes, harnesses, and disconnecters), and the installation labor. An incremental panel price increase that relates to the increase in panel performance is usually tenable. But beyond such a price/performance relationship demonstrated through LCOE, a greater panel performance is not necessarily matched by system cost reduction and may lead to an increase in system cost (in the case of a dramatic increase in panel cost).
One must assess the entire system and its output, not just individual component costs; BOS can be a deciding factor in both initial costs and the lifetime system performance/cost relationship. A higher performance panel (with a cost structure in line with its performance increase) will result in a lower number of panels and strings (for a given system nameplate DC wattage), a lower number of discrete racking mounts, less wiring and gear, and a subsequent decrease in labor. This, coupled with a decrease in the area used, will lower complexity and maintenance over the full 25-year warranted period. All this translates into a lower LCOE that is the most comprehensive way to assess the value proposition of a PV system and its optimized components.
Sol Haroon has 20 years of experience in electronics engineering design and system architecture and leading teams. Currently, he is engaged as a lead systems engineer at Suniva (www.suniva.com). Haroon has 10 years of experience in sustainable energy including direct personal experience with net-zero housing design (solar thermal and solar photovoltaics) and electric vehicle design. Haroon has worked on and designed sustainable houses (including a system to power all-electric cars) engaging principles of both passive solar and active solar. He holds a Bachelor’s of Applied Science in Electrical and Computer Engineering from the University of Waterloo in Ontario, Canada.
With 30 years of experience in high-technology products and markets, Anthony Coker has provided engineered solutions to international clients around the globe. Cocker is responsible for new product partnering, solutions development and emerging markets development. He has also turned his passion for ‘greentech’ into a role as acting Chief Sustainability Officer at Suniva. As a frequent industry speaker and author, Cocker is a thought leader in the Solar PV and Smart Grid industries. He was recently elected as Chairman of the Board of Directors for the Georgia Solar Energy Association. He holds a BChE from Georgia Tech and pursued his executive MBA from Southern Methodist University’s Cox School of Business.
REFERENCES
-Tracking the Sun IV: An Historical Summary of the Installed Cost of Photovoltaics in the United States from 1998 to 2010 (http://eetd.lbl.gov/ea/emp/reports/lbnl-5047e.pdf)
-Sharp Photovoltaic System Price Decline 2010-2011 (http://www.futurepundit.com/archives/008294.html)
-Solar Energy and Cost-Competitiveness (http://www.solarbuzz.com/facts-and-figures/markets-growth/cost-competitiveness)
-Levelized Cost of Energy Calculator (http://www.nrel.gov/analysis/tech_lcoe.html)
-Achieving Low-Cost Solar PV, Rocky Mountain Institute (http://rmi.org/Content/Files/BOSReport.pdf)
For more information, please send your e-mails to pved@infothe.com.
ⓒ2011 www.interpv.net All rights reserved.
|


.jpg)