Despite constituting less than 6% of global installations in 2010, the United States is increasingly becoming a focus of global Photovoltaic (PV) industry attention. As PV system costs fall, electricity prices rise, and project finance returns to the table, the U.S. market is inching closer to reaching its potential as the center of global PV demand.
Three factors provide the U.S. with enormous long-term potential for sustainable market growth. First, the U.S. is home to an excellent photovoltaic resource. Average daily insolation in the U.S. ranges from 3.5 kWh/m2/day in the Northeast and upper Midwest to as high as 8.5 kWh/m2/day in the Southwest. In these regions, insolation reaches levels that are among the best photovoltaic resources in the world. While the Southwest provides the highest insolation, even northeastern states offer insolation that is, at a minimum, equal to or greater than the resources of Germany. Second, there is ample availability of land for PV development. The Western states in particular have large tracts of open land that could support large PV installations.
Third, electricity demand in the U.S. is the highest in the world. Electricity consumption in the U.S. is roughly 7.2 times the total in Germany and nearly 15 times as much as Spain. It is difficult to overstate the magnitude of electricity consumption in the U.S. There are, for example, currently more than 50 individual power plants in the U.S. with generating capacity greater than the cumulative capacity of the entire U.S. PV market.
In 2010, U.S. PV installations more than doubled to an estimated 820 MW, up from 435 MW in 2009. Still, the U.S. share of global demand fell slightly to 5.4%. In fact, the U.S. market share has remained between 5% and 7% since 2005. While other markets such as Spain, Germany and the Czech Republic have faced drastic shifts, the U.S. has seen steady, if incremental, year-over-year growth.

However, 2011 will be a vital growth year for the U.S. market. With the possibility of demand declines in markets such as the Czech Republic, Spain, and Germany, the U.S. is increasingly being viewed as the future hub of global installations. We anticipate that the market will more than double, in the process reaching over 10% market share of global demand.
Meanwhile, incentive structures will change, demand centers will remain in flux, and new business models will emerge to support further market growth. The trends that emerge in 2011 will determine the nature, and fate, of the U.S. PV market.

Expansion Beyond California
California has historically been the bedrock of PV demand in the U.S, accounting for over 80% of national installations through 2005. California was the first state to implement valuable incentives to support PV development, and the U.S. PV market was largely built upon the foundation California established early on. The state’s legislature and its electricity regulatory agency, the California Public Utilities Commission, have consistently shown willingness to expand successful support programs. Three factors are worth noting as determinants of California’s success as a state market. First, incentives for PV installations are available for all market segments. Residential and commercial systems currently receive the benefits of the California Solar Initiative, while the state’s aggressive Renewable Portfolio Standard supports utility-scale systems. As a result, market participants have been able to leverage experience in one segment to gain entry into others. Second, California’s electricity prices are high relative to other high-insolation Western states, creating earlier opportunity for PV cost-competitiveness. Finally, the size of California’s electricity market--exceeded only by Texas--has been crucial in spurring installation volume.
While PV demand in California has grown substantially since 2004, the state’s market share has decreased over the same period. After comprising over 80% of national demand in 2004 to 2005, California fell to 61.7% by 2008. By 2009, California’s market share had fallen to 49%, and preliminary data indicates that California fell below 40% in 2010. Though PV installations in California remain higher than the secondary state markets, the state’s fall in market share indicates these other states are gaining increasing importance. This is a crucial trend for the market.
Although we anticipate that California will remain the largest demand center and a guiding metric for the strength of the U.S. market, it will not be alone in supporting market growth over the next few years. The U.S. comprises 50 states, each of which has a unique regulatory structure and political leadership. Although this increases the complexity of the market, it also allows for flexibility. The danger of over-reliance on a single market structure was demonstrated in Spain in 2009 when the feed-in tariff reduction wreaked havoc on both the regional and global PV market. Though competing in numerous states appears difficult, a company with a multi-state strategy will be at less risk than one focused entirely on California. In particular, the looming sunset of the California Solar Initiative incentives presents a major risk to California market strength. Thus, it is a positive sign that California’s overall market share is on the decline.
The growth of secondary markets such as New Jersey, Arizona, and Colorado is an important trend as the U.S. market ramps up. In addition, a number of tertiary markets have sprouted, each supporting a small proportion of national demand, but enough to see the early development of industry infrastructure (project finance specialists, attorneys, residential integrators, etc.) that lowers system costs and enables further market growth. We anticipate that this trend will continue over the next four years, with secondary markets becoming increasingly central to U.S. demand and California remaining the base upon which the U.S. PV industry gains its strength.
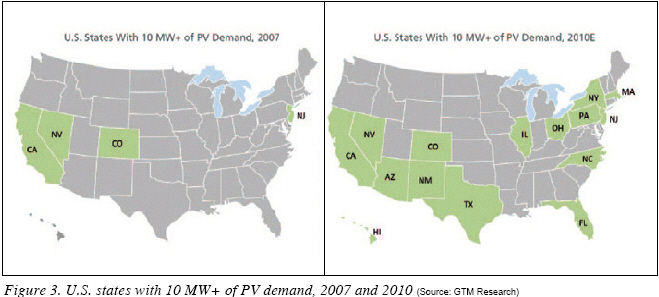
In 2007, only four states (California, New Jersey, Colorado, and Nevada) installed over 10 MW. By 2010, fifteen states reached the 10 MW mark, and New Jersey became the second state to install over 100 MW.
2011 will be the year of demand diffusion in the U.S. Nascent state markets will gain steam, while more mature secondary markets will continue their ascendance. With the exception of the utility PV market (discussed below), U.S. PV demand will see the greatest growth outside its California base in 2011.
Rise of the Utility PV Market
There is less than 350 MW of grid-connected utility PV capacity in the United States. The cumulative operating capacity of this market segment is roughly in line with Germany’s worst installation month in 2010 (February) and is around one tenth of Germany’s best month (June). Despite this, the global PV industry is increasingly turning its attention toward the U.S. utility PV market as a driver of global demand over the next five years. In fact, there are currently 6.1 GW of projects under contract for completion between now and 2014. Add to this an additional 10.5 GW of projects that have been publicly announced and are yet to sign PPAs and we see that the total ‘pipeline’ is more than 16.6 GW. The last of these projects are expected to reach completion in 2016. If all these projects were successfully completed, utility PV capacity will have grown more than 50 times over the course of five years.
It is commonly understood that many of these projects will never come to fruition. Permitting, financing, procurement, and other barriers will delay some projects and kill others. But if even half of the contracted pipeline is completed, the U.S. utility PV market would grow twelve-fold, and that is without accounting for new projects emerging between now and 2015. Herein lies the promise of this market: while it is essentially starting from scratch, the near-term potential has virtually no upper limit.
New entrants to the U.S. utility PV market virtually always place their focus on the California market. This stands to reason, given that California maintains a 75% share of all contracted projects. However, by virtue of being the most established market, California has also become the most competitive for developers. This, along with the more complex and costly permitting and interconnection procedures for California projects, makes it important to consider secondary states with as much rigor as that which is applied to California.
We anticipate that the utility market will ultimately follow the same path taken by the retail PV market. That is, California will be the early market leader, but over time, as additional states pick up demand, California’s market share will fall. However, the utility market today remains in an early section of that curve, having only recently begun to exist in volume. In short, California will likely increase its market share of connected projects over the next three to four years. California utilities have more experience signing utility-scale solar PPAs, they have been early adopters of utility-owned generation models, and California’s RPS remains among the most aggressive in the nation.
In addition, California will soon be home to the innovative Renewable Auction Mechanism (RAM) program. The program is intended to drive small to mid-sized renewable energy development and requires investor-owned California utilities to purchase electricity from solar and other renewable energy systems from 1.5 MW to 20 MW in size. Utilities must award contracts starting with the lowest-cost viable project and move up in price until the capacity requirement is reached for that round. The program will use standard terms and conditions to lower transactional costs and provide the contractual transparency needed for effective financing. To ensure project viability and realistic pricing, the program requires development security and relatively short project development (18 months between contract signature and project operation). In all, the program is expected to begin in late 2011 and support 1 GW of projects through 2013--the vast majority of which will be PV. Over the next two years, this program will serve to maintain California’s lead in the utility market.
In the longer term, though, we anticipate the utility market to mimic the retail market and increasingly to extend outside California’s borders. Outside of California, the U.S. utility market is primarily driven by states with Renewable Portfolio Standards (RPS) with a set-aside or carve-out for solar or for PV. Sixteen states currently have an RPS with specific provisions for solar or DG. By placing a procurement requirement on utilities that increases on a year-over-year basis, Renewable Portfolio Standards present an opportunity for utilities to keep solar on their side of the meter instead of allowing distributed generation to eat away at their customer base. In addition, many RPS standards are back-loaded, growing faster in later years, essentially forcing utilities to procure large quantities of PV generation in order to ensure compliance as the standards increase. Of the 16 states with RPS solar carve-outs, there are ten in which the utility market has already emerged.
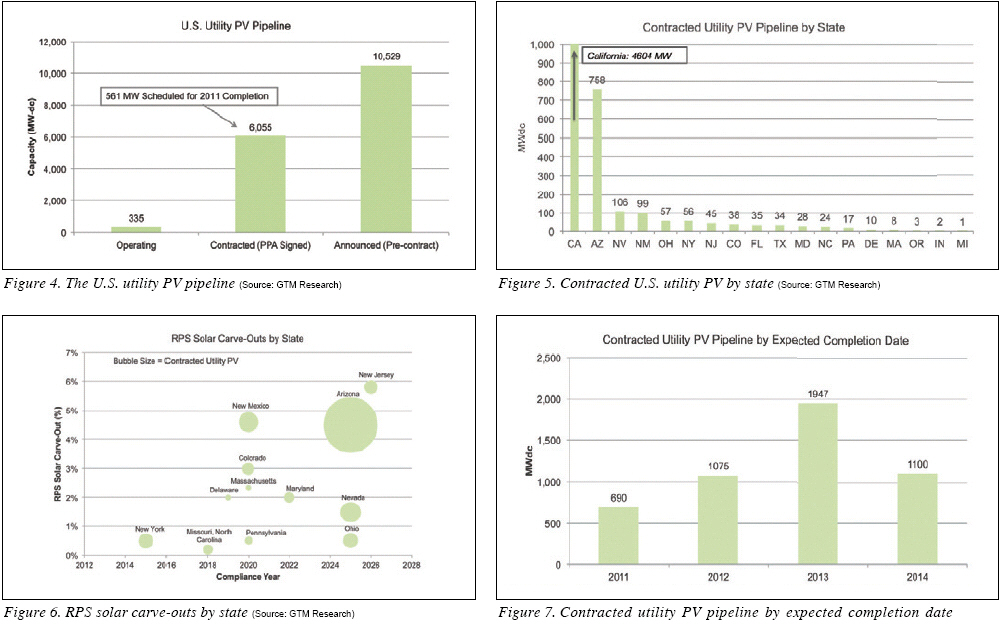
Figure 6 displays RPS solar carve-outs in selected states, including final compliance year, percentage solar/DG required, and the size of each state’s current contracted pipeline. As can be seen, having a larger percentage requirement has not been the only factor in states’ procurement thus far. For example, Nevada has a large pipeline despite a low target, largely because of its proximity to California and ability to sell to California utilities. New Jersey has the largest requirement on a percentage basis, but has yet to see much large-scale procurement given its strong DG market, limited land availability and SREC market uncertainty.
Figure 7 displays the expected completion dates of contracted projects. Virtually all are anticipated to reach completion by 2014, and the vast majority of the associated contracts were signed in 2009 or early 2010. The capacity expected to be connected over the next four years reveals that project timelines largely fall into one of two categories. In the first lie near-term projects with expected cycle times (after signature of a PPA) around two years. This accounts for the more than 1.5 GW scheduled for completion in 2011-2012; a large number of 2009 PPAs fall into this category. In the second category are larger, often multi-hundred MW projects with a three- to five-year time horizon after contract signature. These projects make up a large share of the significant growth shown in 2013-2014.
Overall, 2011 will be a watershed year for utility PV. Installations will more than double from the 2010 rate of less than 200 MW, new utilities will begin procurement, and additional utility procurement programs will be introduced. However, it will also be a crucial period for the market to mature and projects to successfully achieve financing and completion; a large number of high-profile project failures could place a damaging black mark on the nascent market.
All eyes are on the U.S. PV market in 2011. Will it finally reach its potential, or will it remain a niche player on a global scale? Will it be able to replace a demand slowdown in European markets? How quickly can demand ramp up? A year from now, the answer to these questions will be much clearer.
It is difficult not to be bullish about the U.S. PV market. The market potential is enormous, the economics have never made more sense, and the first large projects have been coming online with increasing frequency. Indeed, massive growth appears to lie just over the horizon. However, it is no foregone conclusion. Economic, political, and financial barriers all threaten near-term growth and must be overcome, and system prices must continue their decline. Still, if all goes well, the U.S. market will finally become a PV market leader in 2011.
Enfinity is an international solar power developer (www.enfinitycorp.com).


.jpg)