By FIST IP Overview Team
[Editor’s Note]
The global PV industry has faced considerable development over the past few years with 1.6BC spent in R&D for 2007. Aiming for the lowest production costs by using large R&D effort, large companies have kicked small providers out of game. But today there is a new playground industrial property’s Organic and hybrid photovoltaic cells have seen the arrival of new industrials and academic players from Korea and China. It has been found that Korean companies hold 14% of the overall patents filing in 2006, as much as U.S. companies; Korean filing growth was not expected. For the thin-film technology, the market leader FIRST SOLAR, does not appear in the top 20 of filings The U.S. company may prefer to keep secret its know-how or in-license patents from academic partners and in particular those of NREL, concludes Sylvain Goiran, IP Overview Principal Analyst, FIST SA. Last example to date of this growing
importance of an acute patent monitoring is Oerlikon Solar’s lawsuit against Sunfilm AG.
InterPV will share with you the patent environment in the photovoltaics field in three articles. These articles aim to provide information about some of the key aspects of the PV industry and help InterPV readers identify the driving forces and current trends of the PV industry.
This is the first in a series of three articles and focuses on patents and patent applications, filed between 1985 and mid 2007, that can be associated with crystalline silicon technology.
The second article, scheduled to be published in the March 2010 issue, looks at the PV patent landscape for thin-film cells. The final article, available in the April 2010 issue, examines organic and hybrid cell patent
environment.
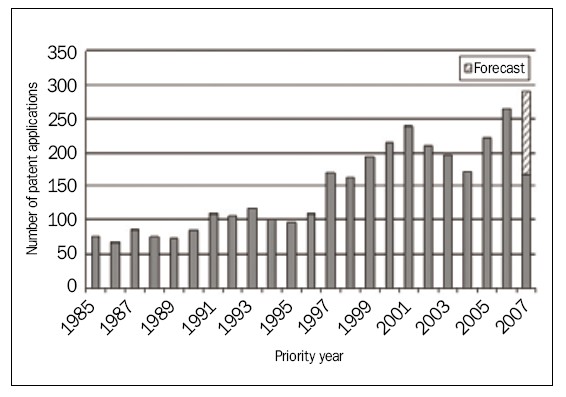
Figure 1. Evolution in crystalline silicon cell patent filings (Source: FIST SA)
Protection Strategies
Evolution in Patent Filings
An observation of the filing of patent applications over time shows that crystalline silicon cells have been actively studied for more than 20 years. For instance, over the period 1985-1995, between 80 and 120 patent applications were filed each year. Several different phases may then be distinguished, namely, the period 1995-2001, which saw a nearly linear growth of filings and may be correlated in particular with the implementation of photovoltaic roof programs connected to the mains network (launched in Germany and in Japan). A period of decline may then be observed up to 2004 (linked to the bursting of the Internet bubble and the crisis that followed) before a new phase of growth (the data for 2007 is incomplete on account of the 18 month delay in publication and has thus been extrapolated).
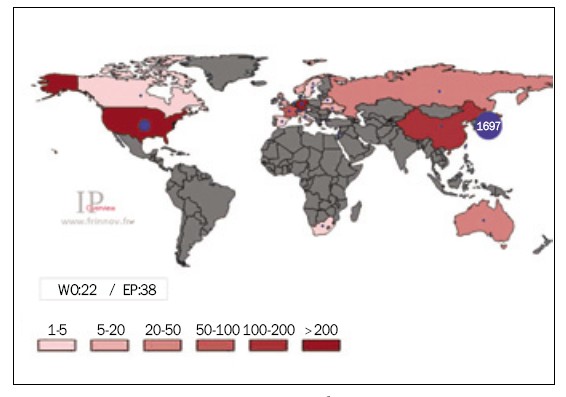
Figure 2. Map of priority filings concerning crystalline silicon cells (Source: FIST SA)
Priority Filings
An analysis of the location of the filings of priority patent applications results in the map shown in Figure 2.
Figure 2 provides an insight into the location where priority patent applications filings are made. This usually provides information not just on the countries of origin of the applicant but also the countries where the research is carried out. The overwhelming weight of priority filings in Japan (1,697 patents filed compared to around, 720 in the United States) since 1985 has two main causes. The first is of a systemic nature. The Japanese patent office is traditionally tougher than other patent offices with regard to problems of the unity of invention. Japanese companies file several patent applications with few claims in instances where an American or European company would only file one. The second is of an economic nature. The market initially emerged in this country and the major companies in the field are principally Japanese, such as SHARP (2nd share of the world market), KYOCERA (4th), SANYO (7th) and MITSUBISHI ELECTRIC (9th).
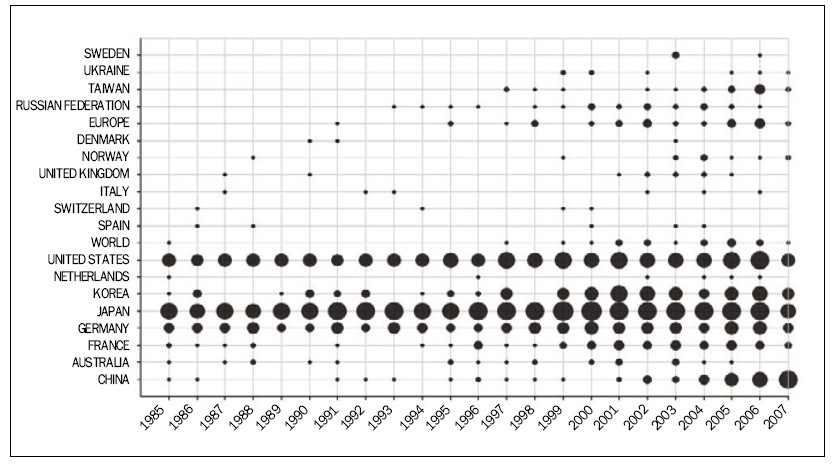
Figure 3. Evolution in priority filings concerning crystalline silicon cells (Source: FIST SA)
Figure 3 shows the dynamic of priority filings and enables the regions where filings are historically important and emerging regions to be distinguished. The historic regions may be qualified, via the national industrial or institutional applicants, as motors for innovation in the photovoltaics field based on crystalline silicon. We can in particular cite Japan, the United States, Germany (which represents 241 priority filings out of the 400 or so filings made in Europe) and to a lesser extent France and South Korea.
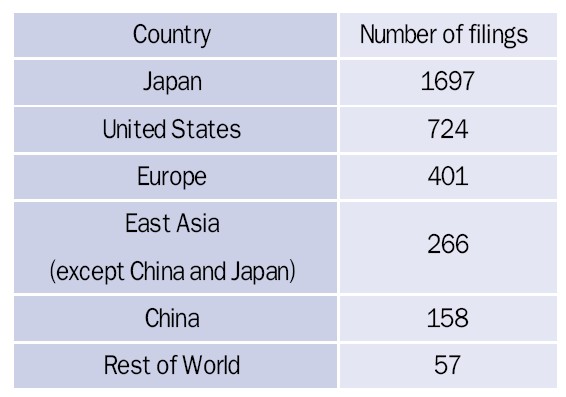
Table 1. Number of filings by country (Source: FIST SA)
Of particular note, within the space of a little less than 10 years, is the appearance of new countries (such as China or Taiwan) and the notable strengthening of the position of South Korea. The emergence of China in this sector is very striking. China, which was comparable in terms of intellectual property rights to a country such as France up to 2004, has become the country with the highest number of priority filings. In fact, around 80 of the 170 patent applications filed in 2007 were Chinese priority filings, compared to 37 Japanese and 22 American. This position clearly reflects the very considerable dynamism of Chinese industrial concerns and academic institutions in terms of research and development.
China, which still has a low volume of priority filings in its territory compared to all of the priority filings made since 1985, has now become an important motor for innovation in this sector. The Chinese government massively encourages the development of photovoltaic sourced energy, since it is faced with an every increasing demand (4,200 TWh forecast in 2020), which necessitates a diversification of supply.
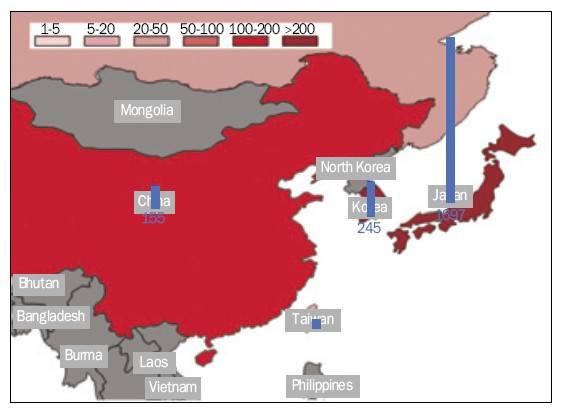
Figure 4. Map of priority filings/Zoom on Asia (Source: FIST SA)
Among the Chinese applicants, it is interesting to see that numerous patent portfolios are institutional, such as those of the Chinese Academy Of Sciences─CAS (5 patents) or the universities of Nankai (5 patents), Shanghai (4 patents) or Tsinghua (2 patents). On average, the companies have very small patent portfolios of around 1 or 2 patents, except in the case of Shanghai Solar Energy Sciences, which holds 10 patent applications. For example, Solarfun Power or Suntech Power are poorly represented with respectively 4 and 1 patents. The respective percentages of patents stemming from governmental institutions and industrial concerns are 40%-60%.
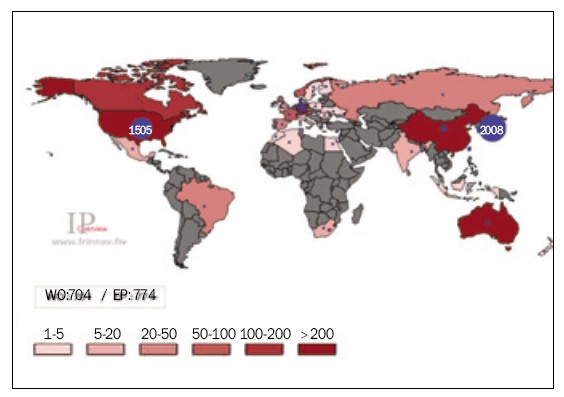
Figure 5. Crystalline silicon cell patent extensions map (Source: FIST SA)
Protection Cover
Figure 5 provides a general outline of the worldwide patent coverage. The analysis of the countries targeted by the extensions confirms the places where the most flourishing markets are situated and where the companies thus hope to obtain a competitive advantage through patent protection vis-a-vis other players. The decision whether to extend or not can also be guided by the countries in which the factories of the direct competitors of the applicants are located, but this trend is easier to highlight by studying the extension strategy player by player.
The most important filing countries are Japan (with more than 2,000 filings) and the United States (more than 1,500 filings). Although the extensions are mainly made in these two countries, it is important to take into account secondary regions such as Europe (around 770 filings via the European examination procedure), China (around 470 filings) and South Korea (around 440 filings).
As for the priority filings, the extensions have since the very earliest days been made in Japan and in the United States and to a lesser extent in Europe (via the European procedure) or in Germany. More recently, the protection of patents has appeared in Taiwan and Singapore, and has strengthened in a clear manner in China and in South Korea.
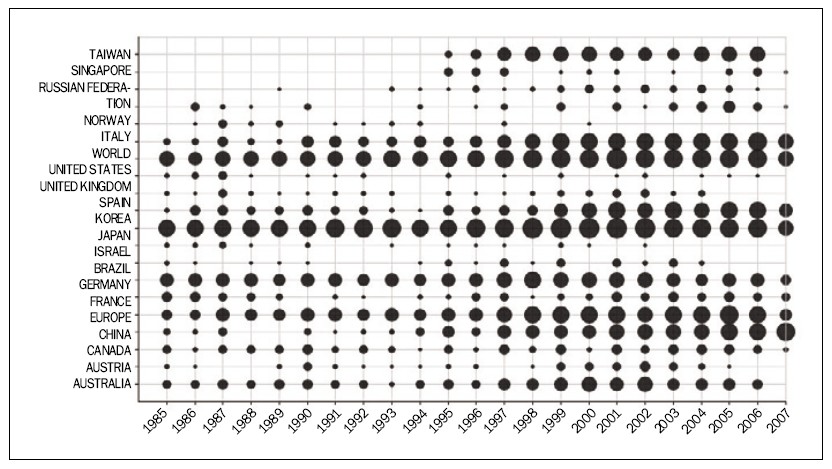
Figure 6. Evolution in extensions concerning crystalline silicon cells (Source: FIST SA)
Technological Maturity Factors
Analysis of the Evolution in Filings
The outlook for the evolution in patent filings is given in figure 7. It is possible to observe a downturn in filings in 2009 linked to the economic climate, which could bring about a significant reduction in the budgets earmarked for patent protection.
Moreover, the probable reduction in R&D budgets in 2009, and perhaps also in 2010, should have an impact on the volume of patent applications filed over the following years. In addition, it should be noted that such downturns have already been observed as a result of two previous crises: the Gulf crisis in 1991-1992 and the bursting of the Internet bubble, which began in 2000.
Nevertheless, in the longer term, this sector should once again experience an upturn due to the energy situation (increase in the price of fossil energies) and policy (incentives in favor of renewable energies, Kyoto Protocol).
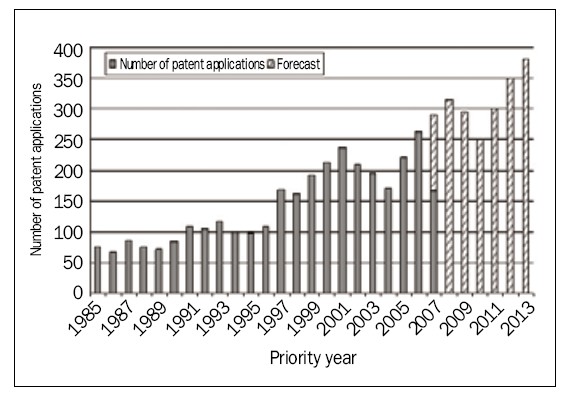
Figure 7. Forecast of the number of filings (Source: FIST SA)
Analysis of Industrial Filings over Time
Figure 8 illustrates the proportion of filings made either by industrial concerns or by academic institutions, as well as joint institutional and industrial filings.
Like most sectors in which the immediate application of the patents is clearly identified, the majority of filings are made by industrial applicants, unlike more fundamental subjects where institutional filings can attain 40% of total filings. It is moreover interesting to note that joint filings between industry and institutions are not very widely practiced in the photovoltaics field.
The increasing proportion of institutional filings is, however, worthy of note, which needs to be correlated with the increase in the number of filings in China, a phenomenon that can currently be transposed into numerous sectors.
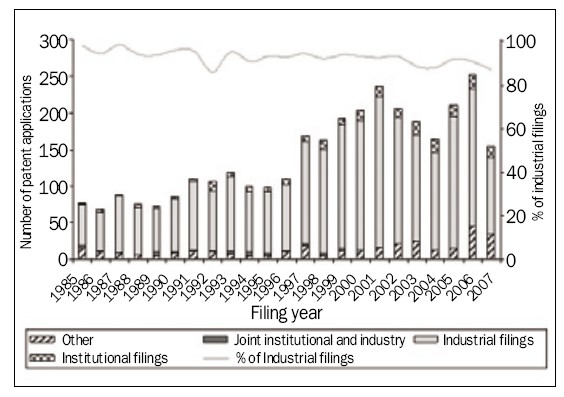
Figure 8. Evolution in the breakdown of industrial patents concerning crystalline silicon cells (Source: FIST SA)
Topology of the Size of Portfolios
Figure 9 gives an insight into the composition of the portfolio of patents and patent applications regarding crystalline silicon cells.
It appears that the majority of players (85%) have a portfolio of less than 5 patents and only 2% of patent portfolios contain more than 50 patents. A considerable number of players exist, including very small firms, universities and research centers, which file in the field without having any specific patent strategy.
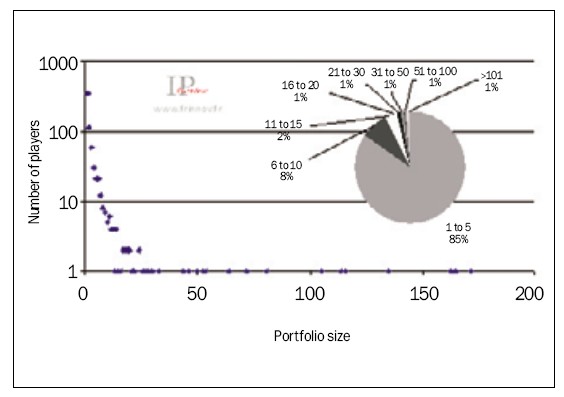
Figure 9. Portfolio size vs. number of players (Source: FIST SA)
Analysis of the Granting of Patents
It is interesting to analyze the proportion of patents granted as a function of the number of filings made. This analysis may be performed on U.S., Japanese and European filings and finally give an insight into the real patent protection. Note that the ratio of U.S. patents granted compared to U.S. patents filed has no sense here and needs to be extrapolated. In fact, before November 2000, U.S. patent applications were only published on the day of granting of the patent and applications that were not granted were never in fact published.
Thus, on the basis of the principle that the proportion of patents granted, filed before 2000, probably did not exceed 80% of the patents filed before this date, the U.S. data may be extrapolated as illustrated in Figure 10.
This figure shows that today, more patents have been granted in the United States than in Japan and Europe, which an analysis of the filings made previously could not predict.
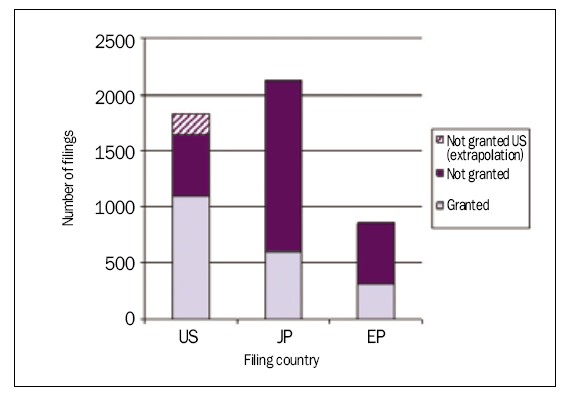
Figure 10. Overview of “crystalline silicon cells” granted patents (Source: FIST SA)
Evolution in the Number of Applicants
Figure 11 shows the evolution in the number of applicants who appear in the patent applications for the year in question (darker curve). Thus, this curve does not represent the total number of players active in the filing of patent applications, since a player may very well not have made any filings over the course of a year. The lighter curve, for its part, represents the annual number of applicants who appear for the first time in a patent application.
An analysis of figure 11 enables two principal phases to be identified:
·The first from 1985 to 1996, during which the number of applicants oscillated between 40 and 60 every year with a significant drop in the number of new applicants up to 1990 followed by a regain in interest up to 1996.
·Then a quite sustained period of growth of applicants between 1997 and 2006, an indication of the increasing attractiveness of the sector, the number of new applicants also increases every year.
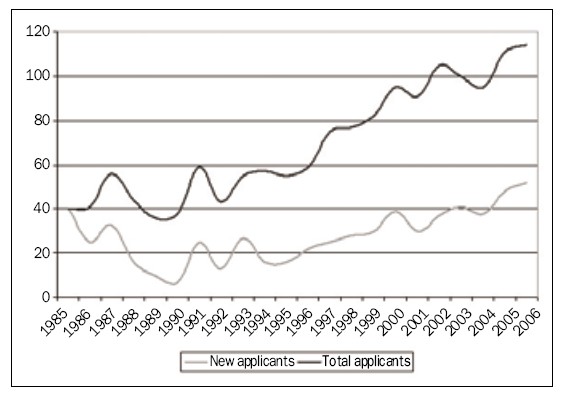
Figure 11. Evolution in the number of applicants (Source: FIST SA)
Moreover, the data for 2006 provides a glimpse of a possible forthcoming surge in interest perhaps even more significant with nearly 55 newcomers in the sector for this year alone.
This graph, thus, shows the increasing attractiveness of this activity sector (significant growth in the annual number of new players). In the short term, it is nevertheless foreseeable that a stagnation or even a drop in the number of new players will be observed given the current economic climate, which is not very favorable to the development of new activities, particularly within industry. In the medium term, although the number of new applicants (dynamism of the sector and arrival of Chinese and Korean industrial concerns, for example) should once again rise since the risks are less significant than during the period 1997-2005 on account of the phenomenon of concentration already initiated in this sector (set up of numerous joint ventures and company acquisitions).
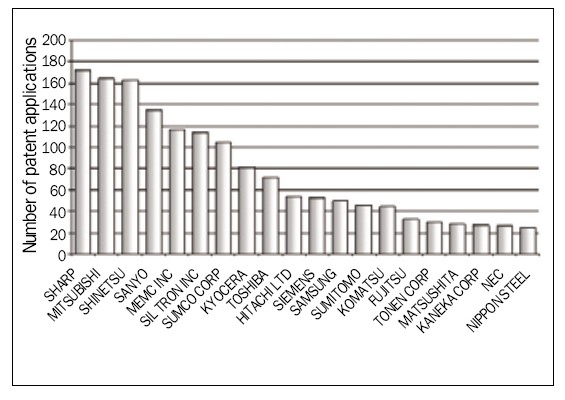
Figure 12. Major applicants in the field (Source: FIST SA)
Applicants
Major Applicants
An observation of Figure 12 shows that out of the 20 major applicants in this sector, 16 are Japanese industrial concerns, 2 are Korean, one is American and finally a single company is German, Siemens. Among these major applicants, there are mainly two types of players namely major electronics groups such as Sharp, Samsung or Matsushita (renamed Panasonic in October 2008) and producers of silicon, which are also usually producers of wafers. In this category may be cited Shinetsu, Memc, Siltroninc (subsidiary of LG). The smallest companies specialized in the photovoltaics sector cannot compete with the size of the portfolios of the large groups, and so none of them appear in this classification.
Finally, it is important to note that there are no institutional applicants among the first 20 applicants.
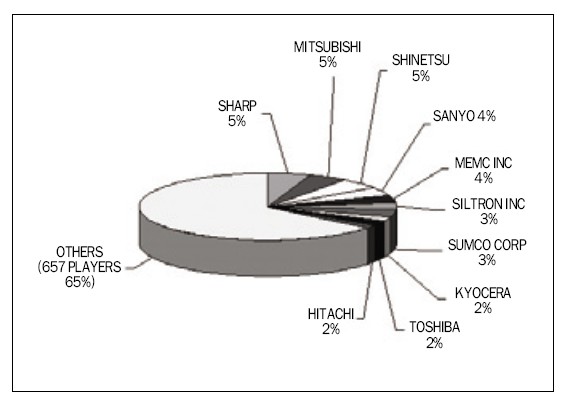
Figure 13. Breakdown of patent portfolios by applicant (Source: FIST SA)
Figure 13 illustrates the breakdown of the patent portfolios of the 10 leading applicants. Thus, 35% of patents are held by these 10 major players. Such an observation is typical of a sector in which patent portfolios are still being built up but in which the major players are already in place. In fact, it is classical to observe, in sectors that are very technologically mature, much higher concentration ratios of patents, namely that 5 major players can share around 80% of patent filings in a given field.
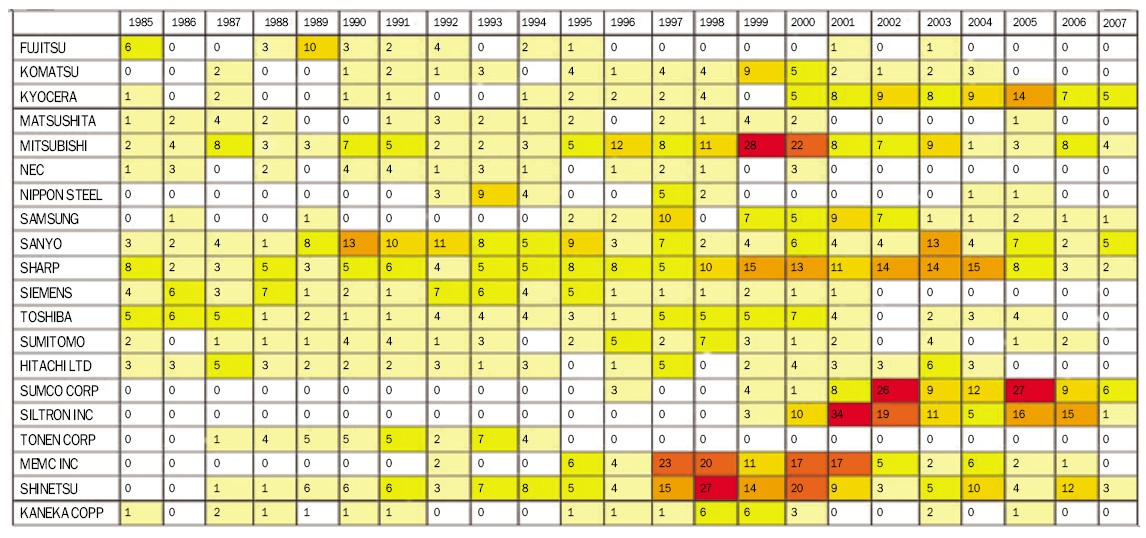
Table 2. Filings of the major players over time concerning crystalline silicon cells (Source: FIST SA)
Table 2 shows the evolution over time of the filings made by the major applicants described previously and makes it possible to highlight the later arrival of filings made by Sumco Corp and Siltron Inc. Note also that Tonen Corp stopped filing in 1994, and the fact that Siemens has not filed any patents on this technology since 2001 (NB: Siemens’ photovoltaic interests have been taken over by the joint venture Siemens Shell Solar).
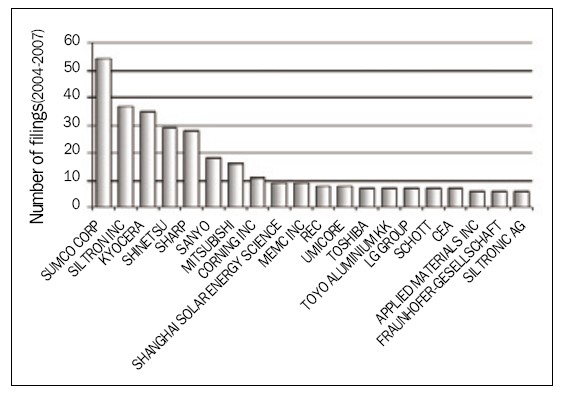
Figure 14. Principal applicants over the period 2004-2007 (Source: FIST SA)
Emerging Applicants
Table 3 highlights the companies or institutions starting to file, which we consider as “emerging applicants” The emergence factor, which enables these applicants to be identified, corresponds to the growth in terms of patent filings over the years 2004, 2005 and 2006.
The player that has filed the most patent applications concerning crystalline silicon cells since 2004 is the Chinese company Shanghai Solar Energy Science & Technology (SSEC). This observation concerning the filings of this company’s patents goes hand in hand with the investment announcements made by SSEC at the end of 2003. For instance, SSEC is investing US$7.25 million in a state-of-the-art solar cell line with an annual capacity of over 10 MW. This company is moreover involved in the “China Renewable Energy Development Project” the objective of which is to develop the local photovoltaics market. Since this date, this company has filed 9 patent applications relative to crystalline silicon cells and has since announced a production capacity of 80 MW.
The Umicore Group, whose original activity is mining, is, in particular, specialized in the production of advanced materials. Moreover, the group has a “clean Technologies” branch, one of the activities of which is focused on the production of materials for the production of photovoltaic cells. For instance, although Umicore is leader in the production of germanium and wafers based on this material for producing solar cells intended for space applications, the company has announced that it has also developed and protected a low cost, extra pure silicon production process.
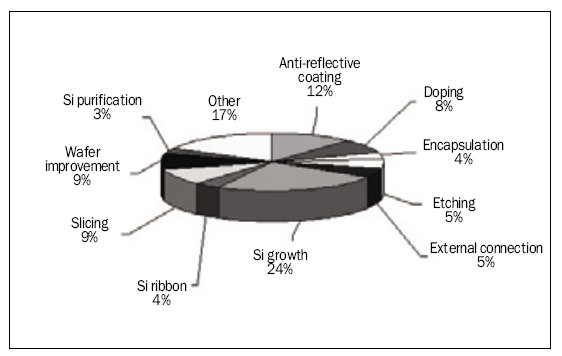
Figure 15. Segmentation of silicon based photovoltaic cell patent portfolios(Source: FIST SA)
The Solarforce Company was, for its part, founded in 2003 by Claude Remy, who formerly founded Photowatt. For the production of its cells, this company uses RST (Ribbon on Sacrificial Carbon Template) technology. This process, already studied by companies such as Philips and Photowatt at the start of the 1980s but without leading to any commercial offshoots, enables the deposition of a silicon film on each of the opposite faces of a carbon support (available in rolls), which is then eliminated by burning. Today, this ribbon drawing method is the only one that offers the potentiality of drawing ultra-thin films (50-80 μm) at relatively high speeds (10 cm/min). Solarforce is currently in a phase of building up a portfolio of patents based on this technology (5 filings between 2004 and 2007) so as to protect its initial positioning for the production of silicon wafers. It should, however, be noted that this company has not yet announced its production capacity.
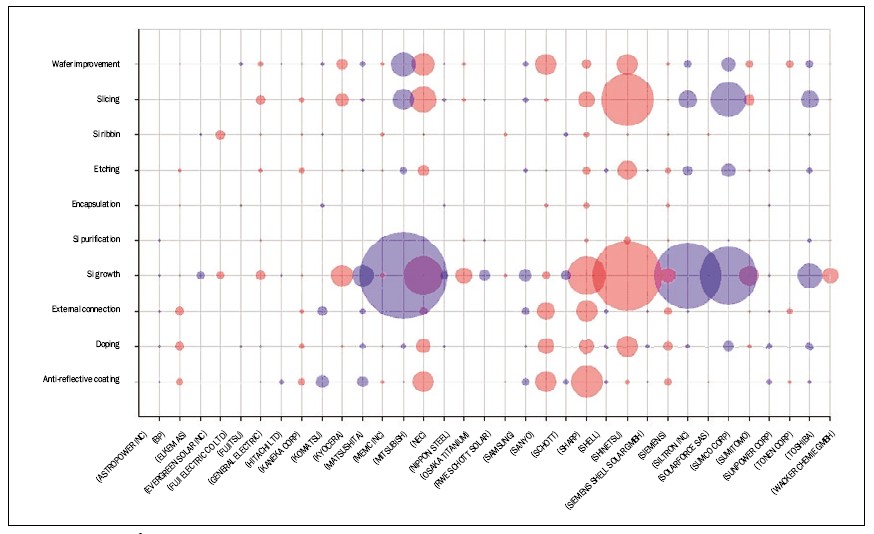
Figure 16. Topics of the major players (Source: FIST SA)
Centrotherm PV AG, whose head office is in Blaubeuren in Germany, is one of the world leaders in the supply of equipment and services for the manufacture of solar cells and the production of solar grade silicon. Centrotherm thus commercializes the principal equipment and turnkey production lines for the manufacture of crystalline or thin film solar cells (Copper Indium/Gallium diSelenide - CIGS). This company’s range of products is moreover completed by reactors and converters for the production of solar grade silicon. This group, which employs more than 1,100 people, operates in Europe, Asia and the United States and in 2008 posted a turnover of 375 million euros. Note then in 2008, in order to strengthen its position with regard to its product range, Centrotherm acquired an interest in GP Solar Gmbh (25.2%), specialized in the quality control and in production processes of photovoltaic cells and modules, and in the Solmic Company (100%) whose core business lies in the optimization of processes for the production of multicrystalline silicon (ingots and wafers).
Solarfun Power Holdings is one of the world leaders in the production of cells and solar panels. This company, which has benefited from the experience in the electronics field of Linyang Electronics (number 1 in China for the production of electric meters and initiator of the creation of SOLARFUN) is in full growth not just in terms of filings of patents but also production equipment. Thus Solarfun has announced an annual capacity of 360 MW in 2008, and expects to attain 420 MW by the end of 2009.
Unlike the previous table, Figure 14 identifies the principal applicants in volume terms (and not in growth terms) between 2004 and 2007.
An analysis of the principal applicants over the last few years makes it possible to highlight the most dynamic players in terms of patent filings. This focus over time brings to light new players such as REC, Schott or even Siltronic AG. In recent years, several institutional applicants have been particularly active in terms of filings, such as CEA (Commissariat a l’Energie Atomique) and Fraunhofer.
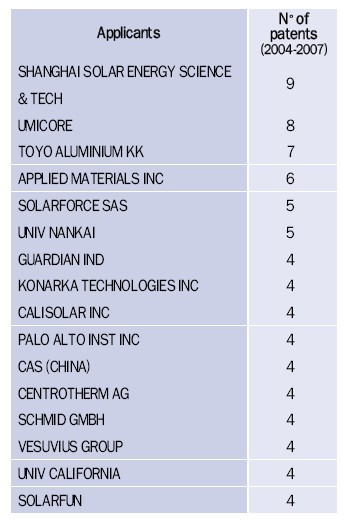
Table 3. Emerging applicants (Source: FIST SA)
Topology of Patents in Crystalline Silicon
Segmentation of Patents by Technologies
The patent portfolios of photovoltaic technologies based on crystalline silicon are segmented into 10 sections, which describe the different key steps in the conception of a cell:
● Segment 1: Si purification (methods for purifying silicon to obtain at least solar grade silicon)
● Segment 2: Si growth (growth processes and manufacture of solar grade silicon ingots)
● Segment 3: Si ribbon (thin-film silicon growth technologies including those that take place in the direction of production (Edge-defined Film-fed Growth (EFG), string ribbon) and those in which growth takes place perpendicularly to the direction of production of the ribbon (Ribbon Growth on Substrate (RGS) type, for example))
● Segment 4: Slicing (cutting ingots into wafers)
● Segment 5: Doping (silicon doping methods)
● Segment 6: Etching (texturing of wafers)
● Segment 7: External connection (concerns technologies linked to the contacts of each cell (front and back) and linked to the interconnections between cells)
● Segment 8: Anti-reflective coating (layer deposition techniques preventing reflections and methods of optimizing the light absorbing surface)
● Segment 9: Encapsulation (methods of protecting cells against external aggressions and their electrical insulation)
● Segment 10: Wafer improvement (techniques for optimizing wafer efficiency such as, for example, tandem amorphous Si /polycrystalline Si techniques)
It is notable that the segments that dominate the sector in terms of volume of filings correspond to the topics that should enable a drastic improvement in the efficiency of cells and topics aiming to cut costs. For instance, filings of patents are essentially made on the problems of growth of ingots of solar grade silicon, improvements to slicing techniques in order to reduce losses of material and the alternative route of obtaining wafers, ribbon technologies (which, when taken together, account for 37% of patent application filings).
Technological Segments Protected by the Major Players
Figure 16, which represents the topics patented by the major applicants, clearly reflects the organization of these industrial concerns. For instance, players that are vertically integrated file patent applications over the whole added value chain, as attested by the examples of Mitsubishi, Sharp, Siemens or, to a lesser extent, Kyocera. Sanyo, whose integration is also vertical, does not seem for its part to favor the filing of patents concerning the growth of silicon, although it has silicon and wafer production plants.
The position of silicon producers is also very clear, with a large majority of filings relating not just to the growth of silicon but also methods for slicing ingots or instead concerning improvements to wafers (MEMC, Siltron Inc, Sumco, Wacker, etc.). The small patent portfolio of Elkem, which is nevertheless one of the world leaders in the production of silicon, particularly for solar applications, should however be noted.
Other companies, such as BP, Kaneka or Siemens, mainly focus their filings on actually forming the cell (doping, forming contacts, etc.).
Among the protected topics, the position of maybe ten or so companies on ribbon technologies is of note. These technologies, which are not recent, were initially penalized by the low cost of silicon stemming from waste from the microelectronics industry, which made slicing ingots more profitable than direct growth in the form of wafers. Nevertheless, some companies have based their strategies on the production of silicon wafers based on ribbon technologies such as Rwe Schott Solar (EFG technology), Evergreen (String Ribbon technology), Solarforce (Ribbon Growth on Substrate technology) or Ebara (Dendritic Web Growth technology).
Finally, note that the industrial concerns involved in the sector file very few patent applications relative to encapsulation, which is explained by the fact that it involves techniques quite remote from the core business of cell producers.
FIST IP Overview team (http://www.frinnov.fr/) is expert in IP analysis and in the positioning of patent portfolio in many fields (memories, optical components, microscopy, HIV/AIDS, CDK inhibitors, Malaria, carbon nanotubes, green solvents, liquids effluents treatment, antenna, medical imaging, etc.). They developed the IP Overview product in 2008.
For more information, please send your e-mails to pved@infothe.com.
ⓒ www.interpv.net All rights reserved
|


.jpg)